
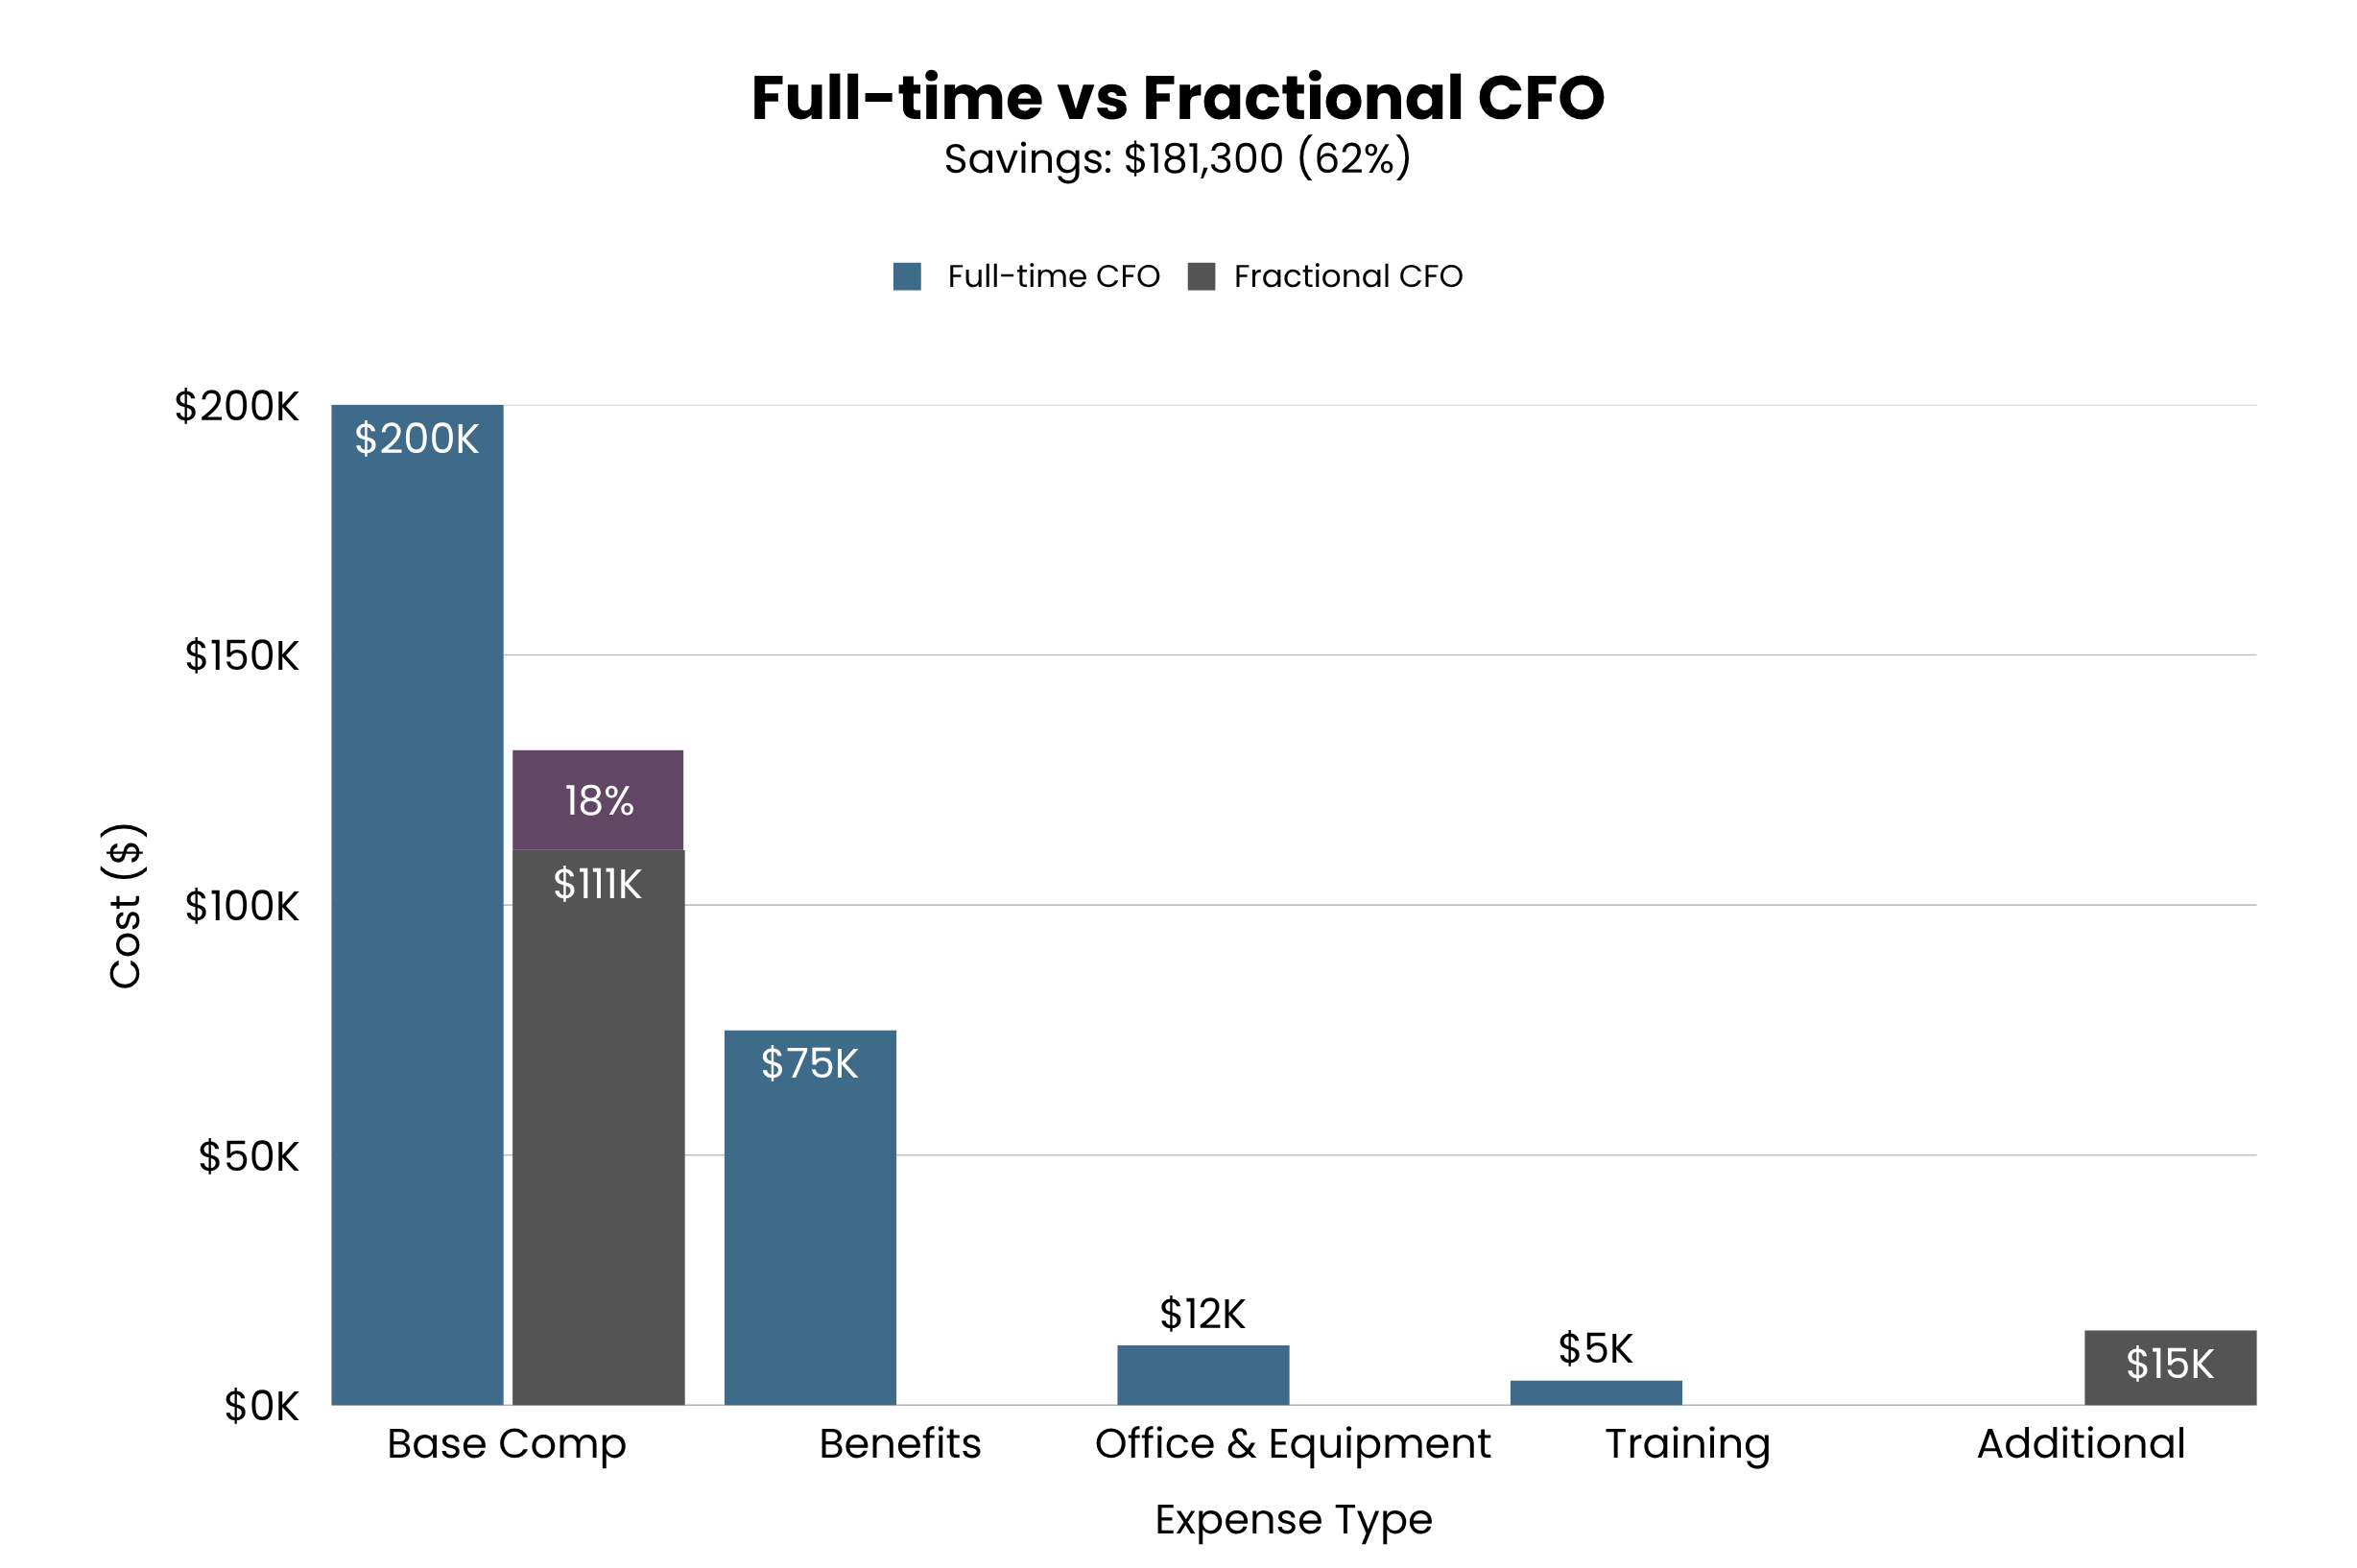
Scout Financial proposes delivering comprehensive fractional CFO services to Verbum Dei Jesuit High School, providing executive-level financial expertise at a fraction of the cost of a full-time CFO hire. Our proposal addresses the unique financial complexities facing Cristo Rey schools while supporting Verbum Dei’s mission to serve disadvantaged youth in South Los Angeles. Through our specialized nonprofit expertise and deep understanding of educational institutions, we will deliver strategic financial leadership that enhances transparency, strengthens governance, and supports sustainable growth.
Verbum Dei Jesuit High School operates within a distinctive educational model that presents both opportunities and challenges. As a member of the Cristo Rey Network serving 300 students, predominantly from low-income Latino and African American families, Verbum Dei provides a rigorous college-prep education and a unique Corporate Work Study Program (CWSP) that gives students real-world work experience. Serving the community for over 60 years – Verbum Dei is woven into the fabric of Los Angeles.
It costs about $23,000 per student annually, families contribute on average about $1,200 (5%) of that cost. The remaining 95% “funding gap” is covered by philanthropy (roughly 55% of costs) and the work-study program (about 25%), with other sources bridging the rest. This mission-driven model creates both opportunities and challenges for the school’s finances. This model creates complex financial dynamics requiring sophisticated management of multiple revenue streams, work-study logistics, and regulatory compliance.
The school’s remarkable achievements, including 15 consecutive years of 100% college acceptance rates, demonstrate the impact of the Verbum Dei’s model. However, like many Catholic schools, Verbum Dei faces ongoing financial pressures in an environment where “the economics are a becoming increasingly challenging.”
Scout Financial brings over 150 years of combined experience in financial services, with specialized expertise in nonprofit accounting and CFO services. Founded in 2012 and headquartered in Pasadena, California, our firm has developed deep competencies in serving mission-driven organizations.
Our team’s specialized knowledge in nonprofit accounting ensures we understand the unique requirements facing organizations like Verbum Dei, including grant management, restricted fund accounting, and regulatory compliance.
Our comprehensive fractional CFO services will encompass ten key areas designed to address Verbum Dei’s specific needs. Strategic financial planning will receive the highest priority with 48 annual hours dedicated to developing comprehensive financial plans aligned with the school’s mission and objectives.
| Service Category | Monthly Hours | Quarterly Hours | Annual Hours | Priority Level | Deliverables |
|---|---|---|---|---|---|
| Strategic Financial Planning | 4 | 12 | 48 | High | Strategic plan, financial projections |
| Board Reporting & Governance | 3 | 9 | 36 | High | Monthly board packets, quarterly reports |
| Cash Flow Management | 3 | 9 | 36 | High | Cash flow forecasts, liquidity management |
| Grant Management & Compliance | 2 | 6 | 24 | Medium | Grant compliance reports, documentation |
| Budgeting & Forecasting | 3 | 9 | 36 | High | Annual budget, quarterly forecasts |
| Risk Management & Controls | 2 | 6 | 24 | Medium | Internal controls assessment, policies |
| Audit Preparation & Support | 1 | 3 | 12 | Low | Audit schedules, documentation prep |
| Fundraising Financial Support | 1 | 3 | 12 | Medium | Financial data for campaigns |
| Work-Study Program Oversight | 1 | 3 | 12 | Low | Work-study financial tracking |
| Regulatory Compliance | 1.5 | 4.5 | 18 | Low | Form 990, state filings |
Board reporting and governance support will consume 36 annual hours, ensuring transparent communication with the Board of Directors through monthly board packets and quarterly reports.
Cash flow management represents another critical area requiring 36 hours annually to maintain operational liquidity and financial stability. Grant management and compliance will receive 24 hours of dedicated attention to ensure proper stewardship of restricted funds and donor requirements. Our budgeting and forecasting services will provide 36 hours of strategic planning support, while risk management and internal controls will receive 24 hours of oversight.

Verbum Dei maintains an exceptionally strong liquidity position with $25M in total assets
This provides 15 months of operating expense coverage, indicating robust financial stability but also revealing opportunities for enhanced cash management and investment optimization.
Our analysis reveals significant revenue concentration risks requiring strategic attention:
The heavy reliance on donor contributions creates revenue volatility that demands sophisticated financial forecasting and donor stewardship strategies.
Cash Flow Volatility
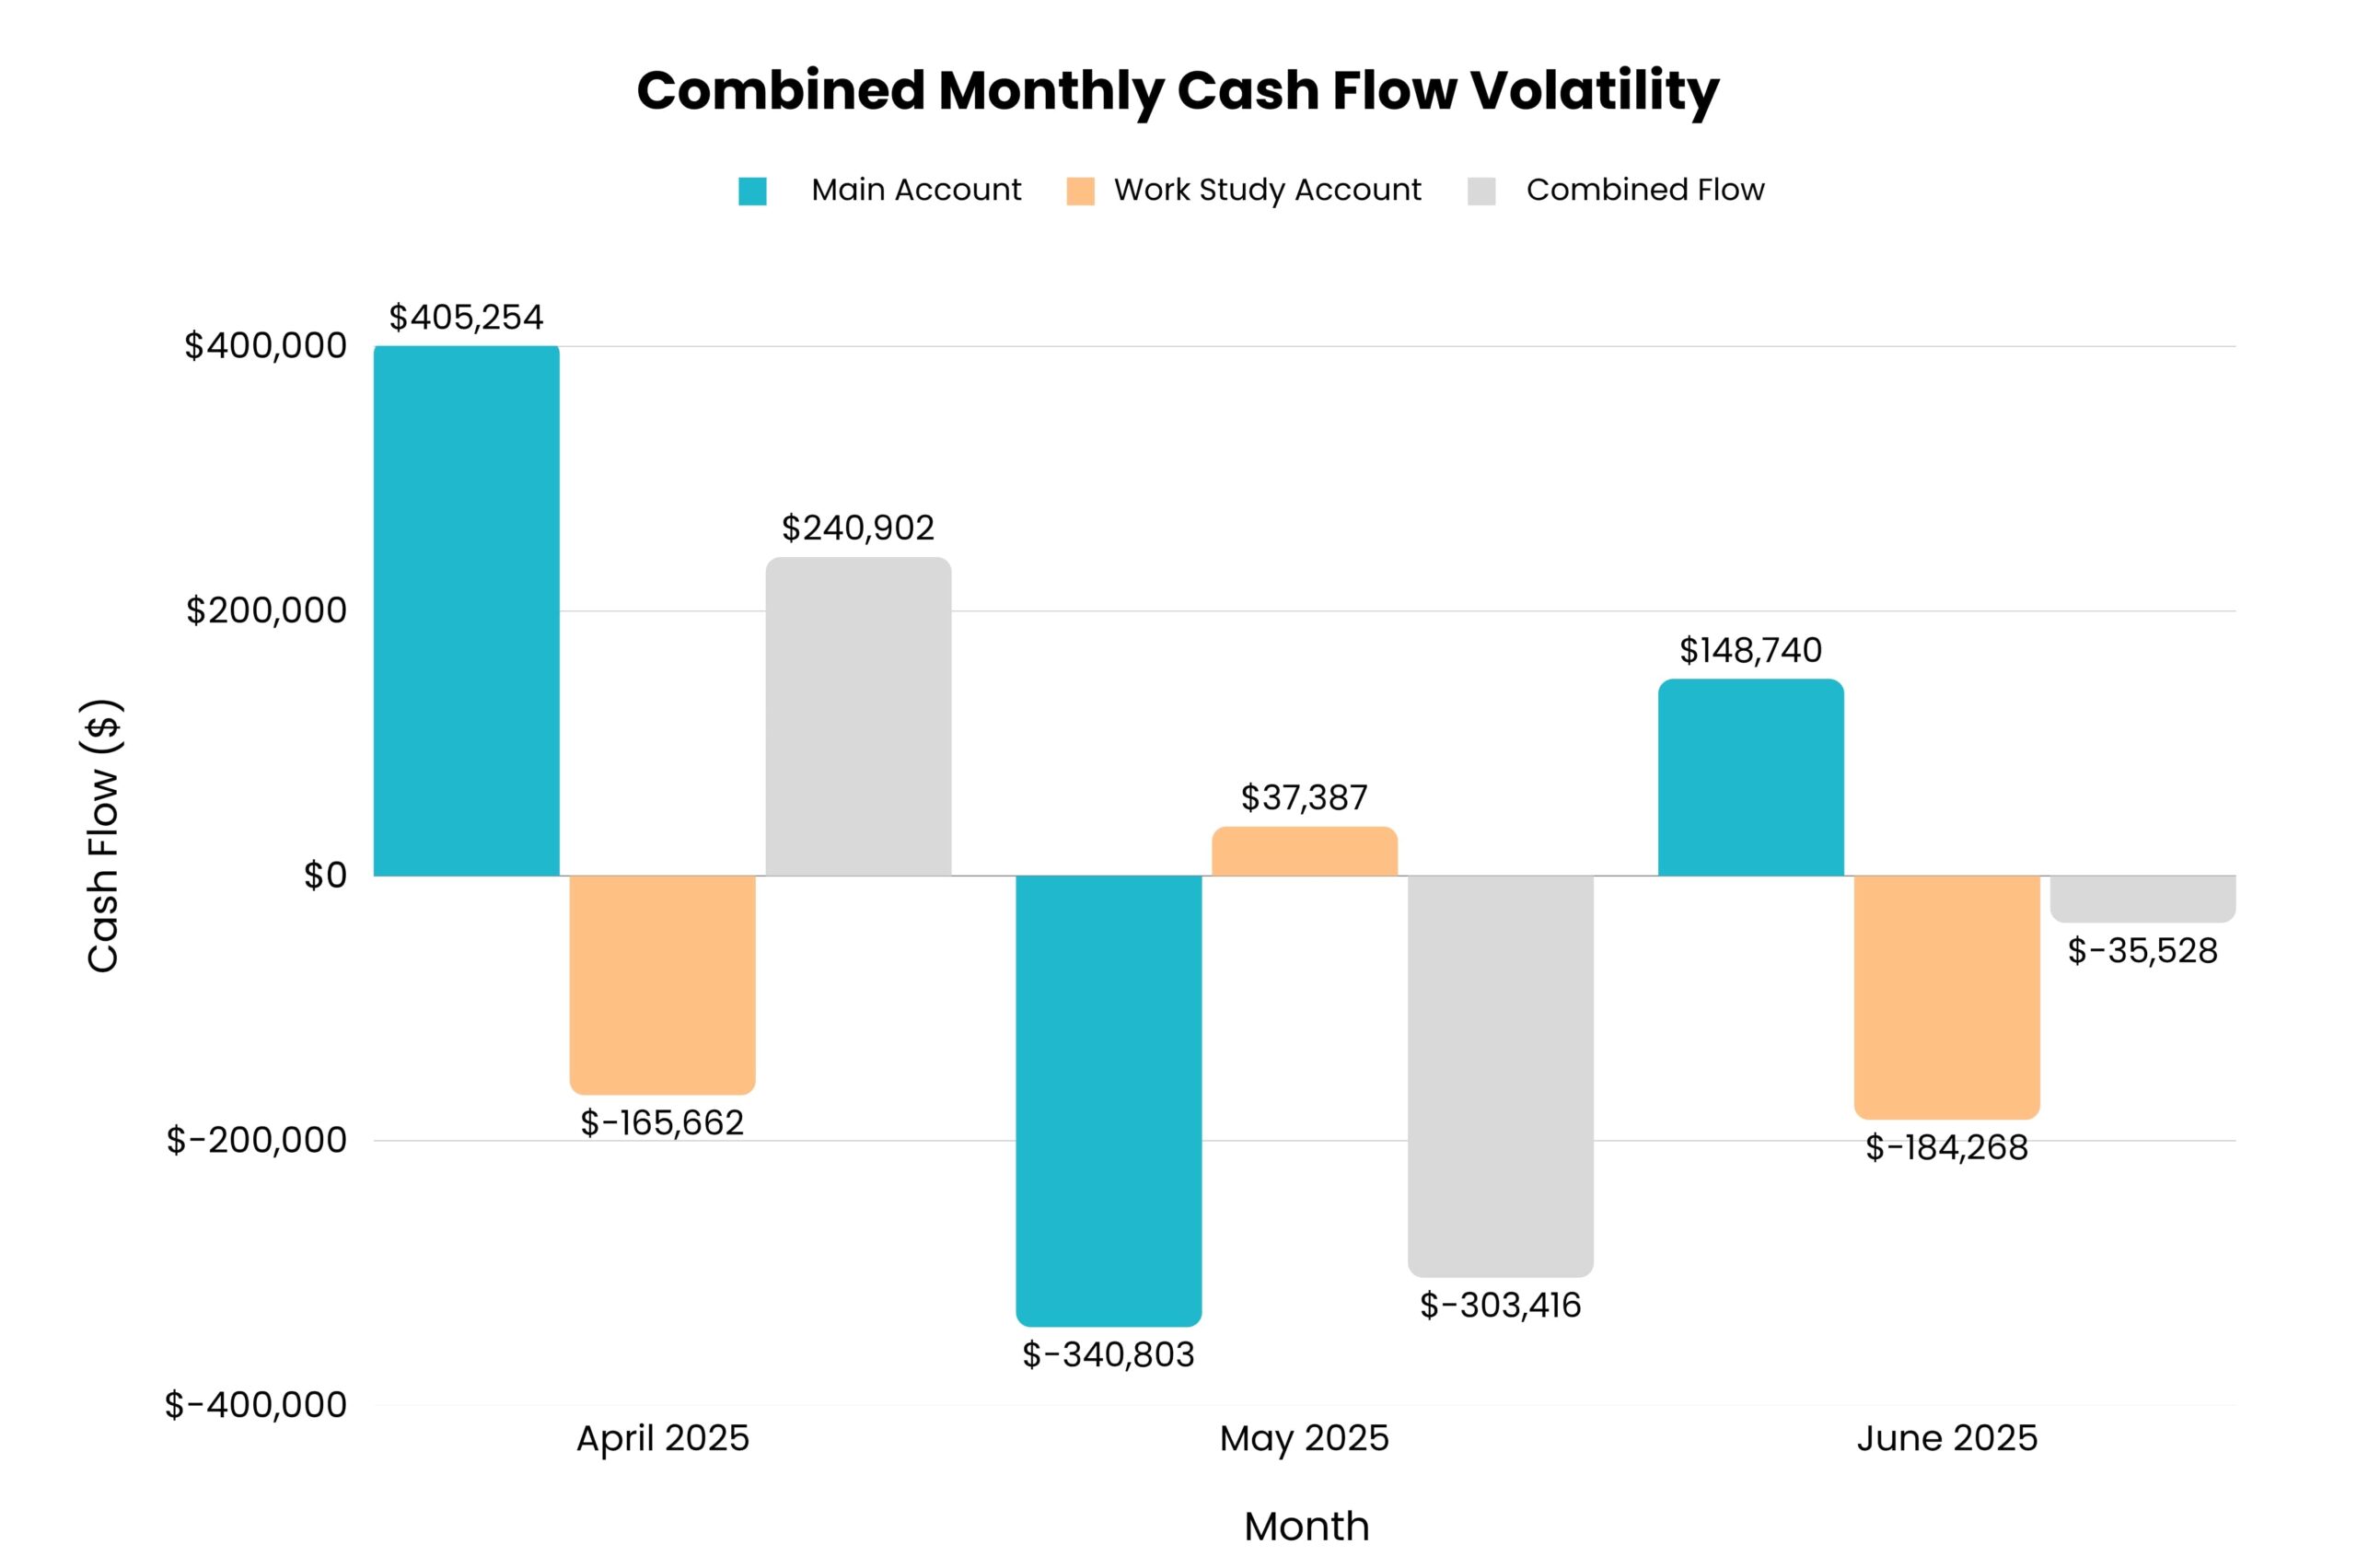
Monthly Net Cash Flows:
Statistical Volatility Metrics
The main account demonstrates extreme volatility with monthly swings exceeding 400% coefficient of variation.
The $747,327 monthly range represents nearly one full month of operating expenses, indicating significant liquidity risk requiring professional cash flow management.
Monthly Net Cash Flows:
Statistical Volatility Metrics
The Work Study subsidiary shows consistent cash consumption with only one positive month. The $184,268 June outflow represents 631% of the beginning balance, indicating substantial operational cash requirements.
Consolidated Monthly Performance
Critical Risk Factors
The combined analysis reveals multi-layered volatility risk:
Operational Impact
The combined swing analysis demonstrates need for:
The $9.3MM investment portfolio currently yields 3.80%, concentrated in conservative money market instruments. This presents opportunities for yield optimization while maintaining appropriate risk management for a mission-driven institution.
Potential Annual Value: $93,407
Current investment allocation in money market funds may be overly conservative given the institution's strong liquidity position. A strategic asset allocation review could potentially increase yield by 1% while maintaining appropriate risk levels.
Potential Annual Value: $146,000
Implementing advanced financial controls, vendor management optimization, and process improvements could achieve 2% operational efficiency gains on the $7.9M annual operating budget.
Potential Annual Value: $52,500
Optimizing the deployment of the $10.5M in liquidity through enhanced cash flow forecasting, sweep accounts, and strategic cash positioning could generate .5% in additional returns.
Focuses on discovery and setup during weeks 1-4, including stakeholder meetings, current state assessment, and service agreement finalization.
Key actions include:
Addresses systems integration during, encompassing financial systems review, reporting setup, and board presentation preparation.
Key Milestones:
Implements core processes during weeks 13-15, establishing monthly reporting cycles, cash flow processes, and grant tracking systems, including:
Begins full-service delivery starting in week 16, providing complete fractional CFO services and strategic planning support including:
Focuses on optimization beginning in month 5, including performance review, service optimization, and expanded support planning. Key areas of focus include:
Goal is that the fractional CFO has established a firm command of Verbum Dei’s finances, demonstrated quick wins (cost savings or revenue finds), and set up the tools (forecasts, dashboards, processes) that put the school on a proactive financial footing. The next steps beyond 90 days would involve executing medium- to long-term strategies (deeper cost restructuring, multi-year financial planning aligned with the strategic plan, conducting a feasibility analysis for any debt financing, etc.)
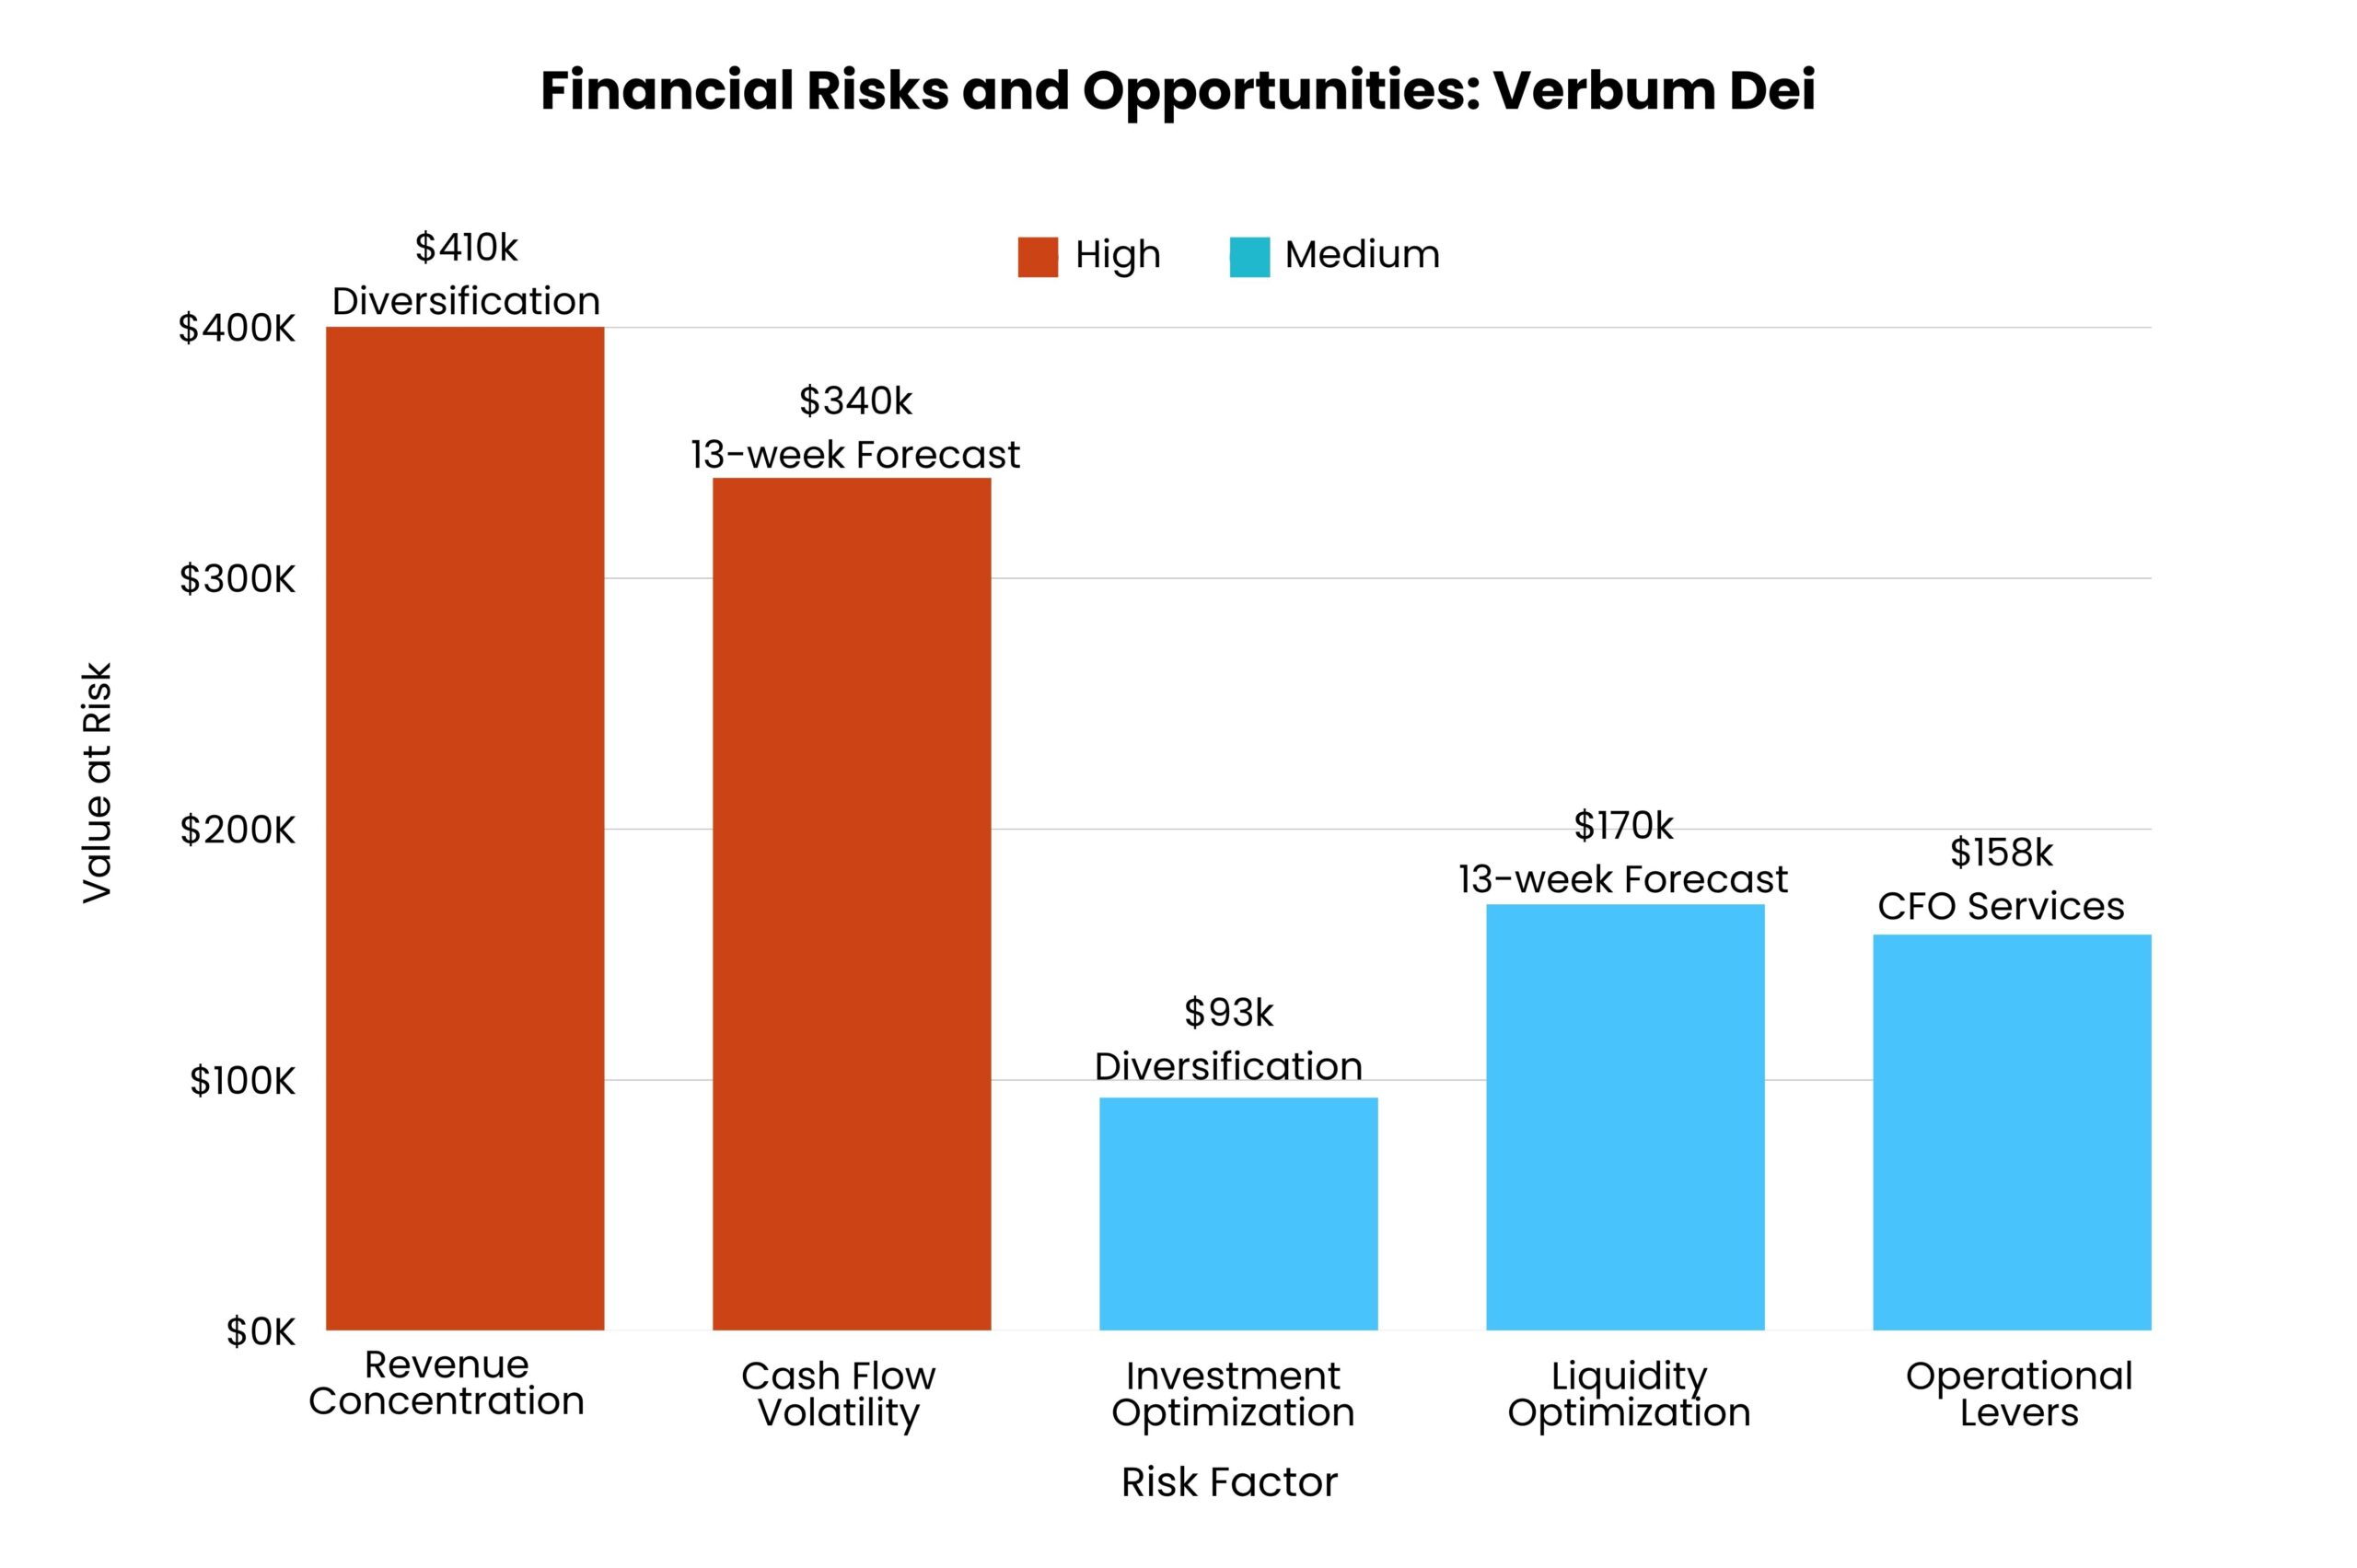
51.9% donation dependency creates $410,000 annual value at risk from potential 10% revenue decline. Mitigation through revenue diversification planning and donor stewardship enhancement.
10.5x volatility ratio threatens $340,000 value at risk from liquidity crisis. Mitigation through 13-week rolling forecasting and cash management protocols.
Limited CFO-level oversight creates immeasurable governance risk. Mitigation through professional fractional CFO services and board governance enhancement.
3.8% yield versus market potential creates $93,000 annual opportunity cost. Mitigation through asset allocation optimization and yield enhancement strategies.
$10.5M excess cash underutilization creates $170,000 opportunity cost. Mitigation through strategic cash deployment and investment protocols.
Verbum Dei operates within market norms but shows opportunities for 2% efficiency gains worth approximately $158,000 annually.
| Risk Factor | Value at Risk / Opportunity Cost | Source Calculation |
|---|---|---|
| Donation Dependency | $410,000.00 | $4.1M donations × 10% |
| Cash Flow Volatility | $340,000.00 | Largest single negative monthly outflow |
| Investment Underperformance | $93,000.00 | $9.3M × 1% yield gap |
| Liquidity Optimization | $170,000.00 | $8.5M × 2% yield gap |
| Operational Levers | $146,000.00 | $7.3M × 2% Operational Optimization |
2-3 weeks for board review and approval
Finance Committee recommendation to full Board
Service agreement and compensation structure approval
Comprehensive stakeholder alignment session
Contract execution and payment terms setup
Week 1 service delivery commencement
Board-approved performance targets for FY2026
Monthly progress tracking and quarterly reviews
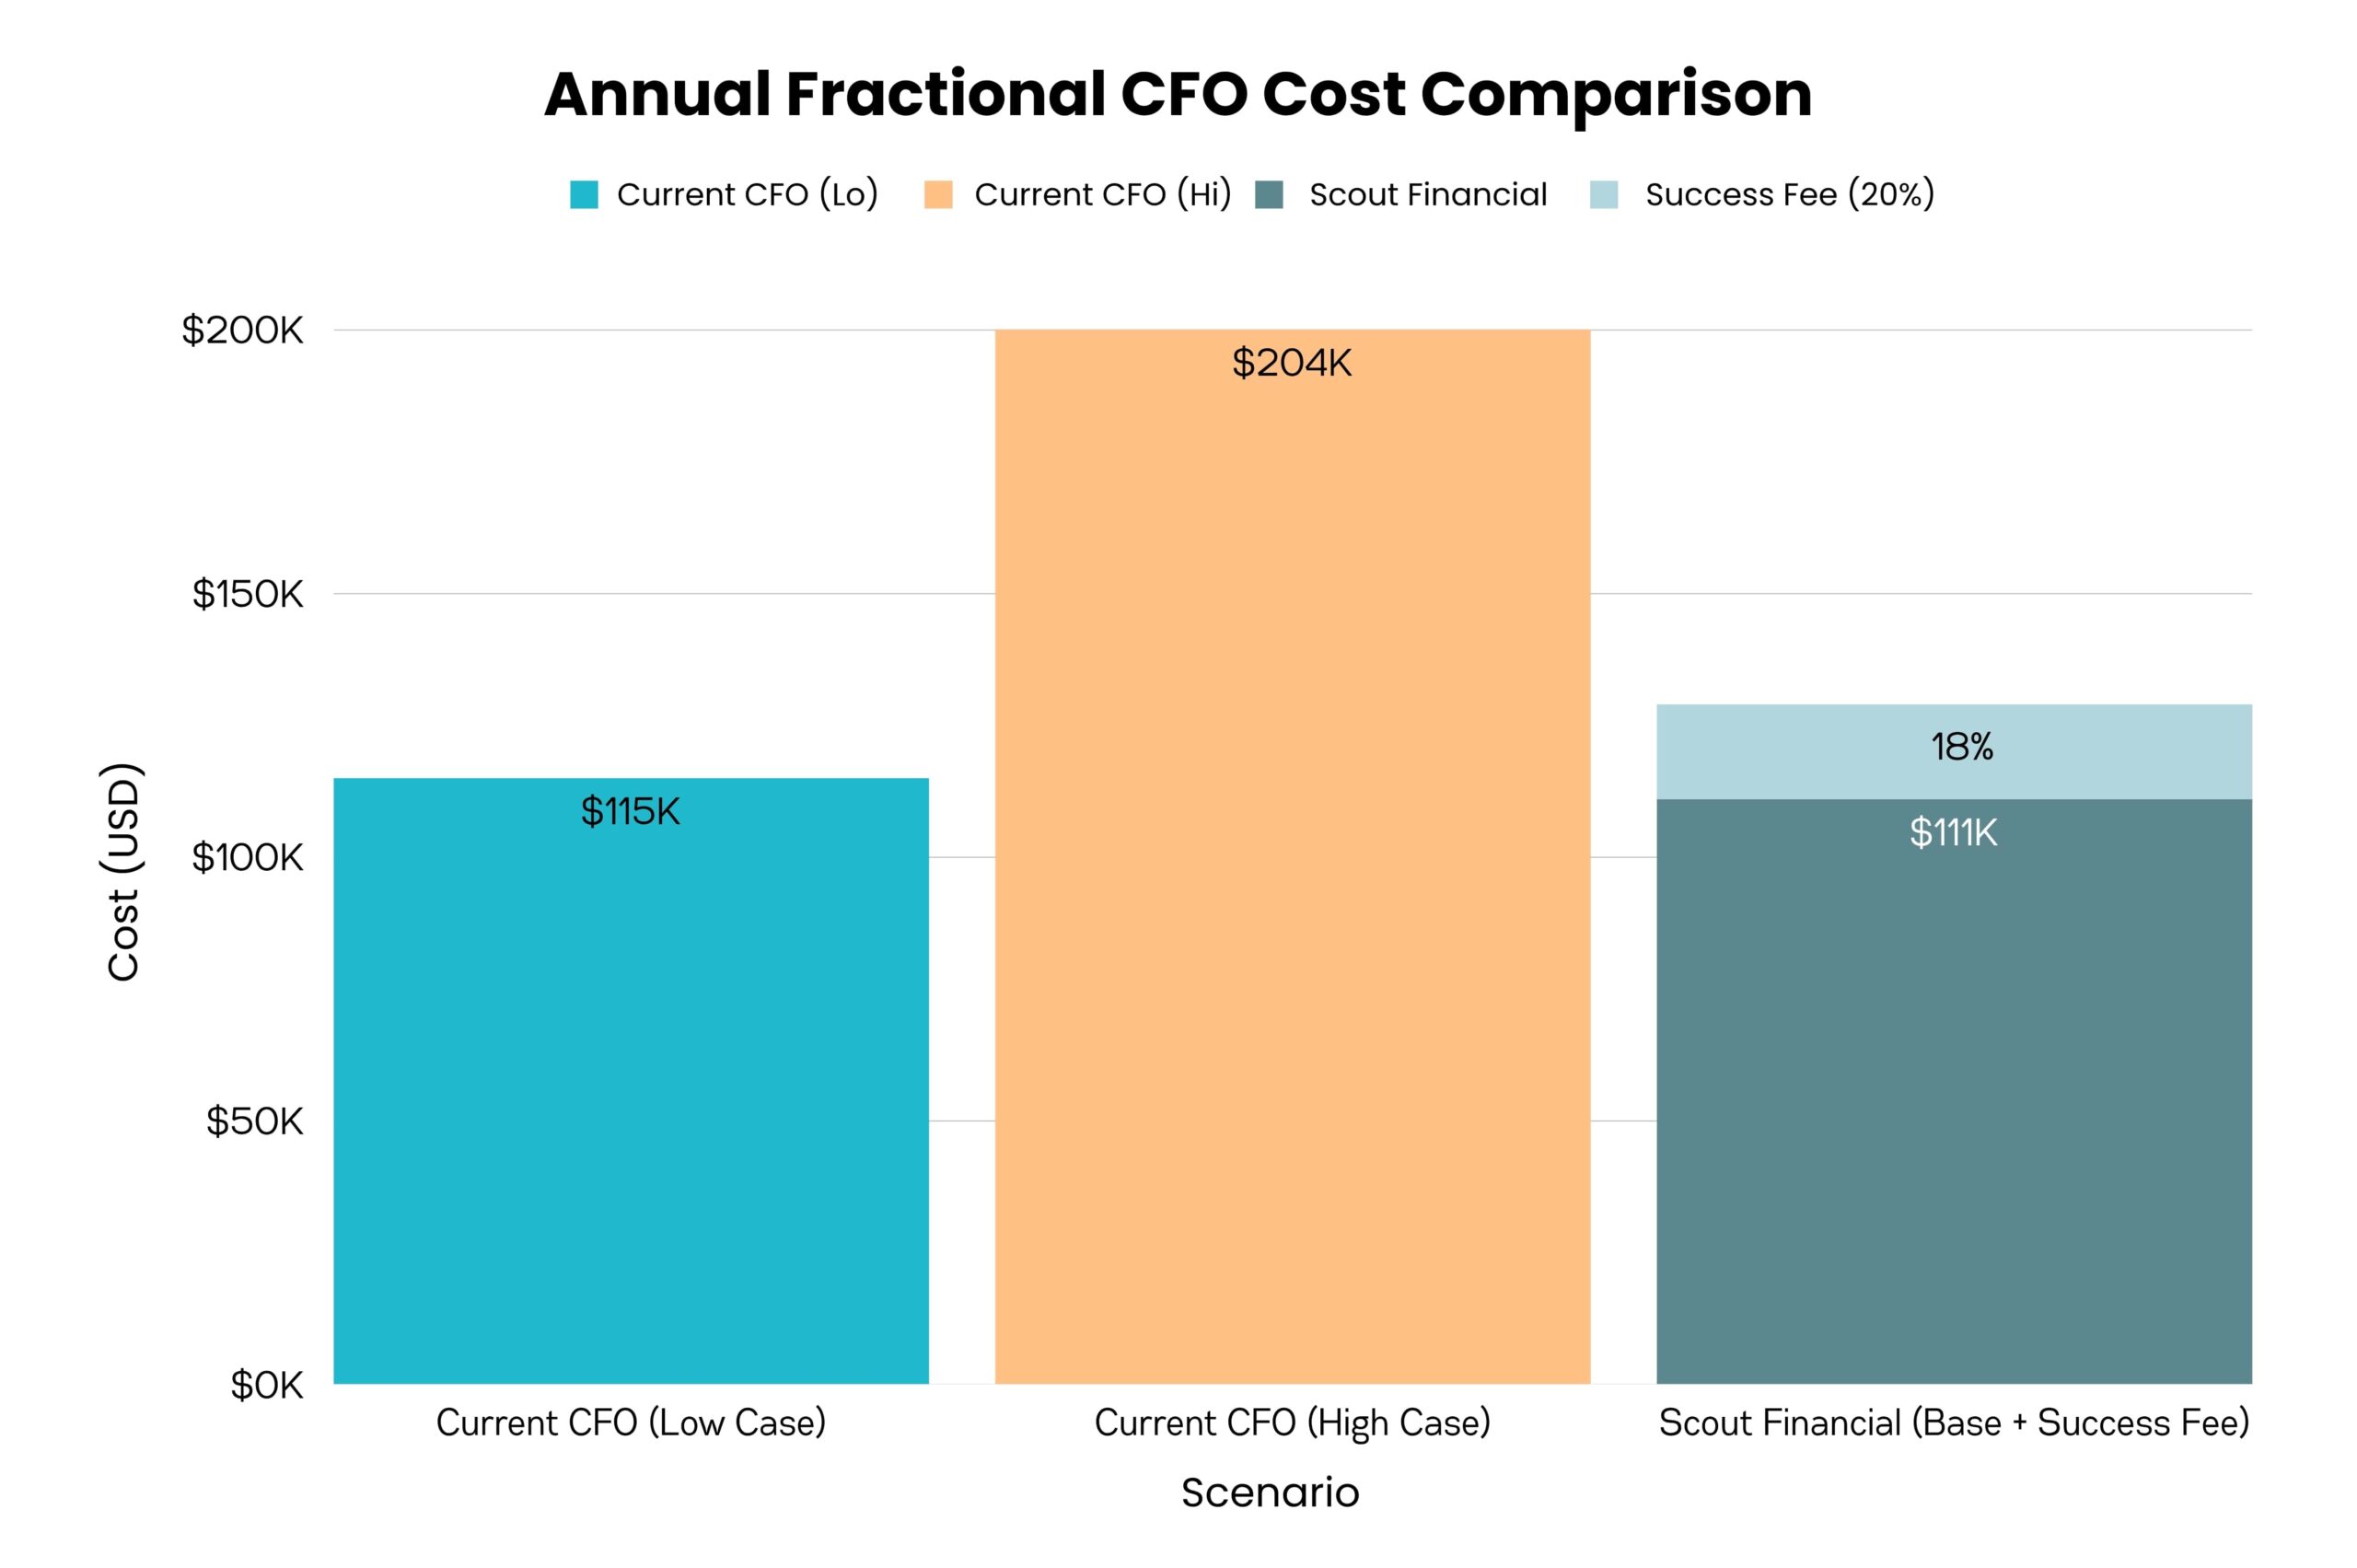
Success fee assessment and service renewal consideration
Trigger: FY2026 expenses $100K+ under $7.3M budget
Rationale: Operational efficiency improvements through vendor optimization and cost controls
Trigger: Convert projected $182K deficit to break-even or surplus
Rationale: Financial stewardship preserves reserves and program funding
Trigger: Increase cash position by $1M+ or achieve 20% donor diversification
Rationale: Enhanced financial resilience and reduced concentration risk
Copyright ® 2025 Scout Financial. All Rights Reserved.